Live research notebook / CERN Open Data

Revisiting a search for new physics

A modern public-data reproduction of my 2016 ATLAS analysis: a search for heavy resonances decaying to a fully hadronic top-quark pair at a centre-of-mass energy of 13 TeV.

Experiment: ATLAS Data: 2015–2016 public release Channel: fully hadronic tt̄ Status: active

Current status

Complete

Analysis specification

The thesis selection, control regions, background method, and target observables have been extracted.

Complete

Public-data inventory

Six checksum-verified PYTHIA QCD slices, JZ3–JZ8, have been validated and cross-section stitched. Large-R jets, tracks, electrons, triggers, and track-jet b-tagging are present.

In progress

Simulation mistag study

The first plots will reproduce the pre-tag and post-tag jet spectra, top-candidate mass, and mistag rate in simulation.

First reproduction target

The initial target is Figure 7.5 of the thesis, beginning with simulation:

  1. Pre-tag C/A R=1.5 jet pTThe leading eligible large-R jet before application of the top tagger.
  2. Post-tag C/A R=1.5 jet pTThe spectrum after a HEPTopTagger candidate with mass between 140 and 200 GeV is required.
  3. Top-candidate massThe reconstructed HEPTopTagger candidate mass before the final mass-window requirement.
  4. Mistag rate versus jet pTThe number of tagged QCD jets divided by the number of pre-tag QCD jets in each pT bin.

Modernisation note. The public 13 TeV PHYSLITE release does not store the historical C/A R=1.5 jets or HEPTopTagger decisions. It does store modern anti-kt R=1.0 UFO jets with constituent links. We are testing an explicit reclustering and HEPTopTagger reconstruction before choosing any substitute tagger.
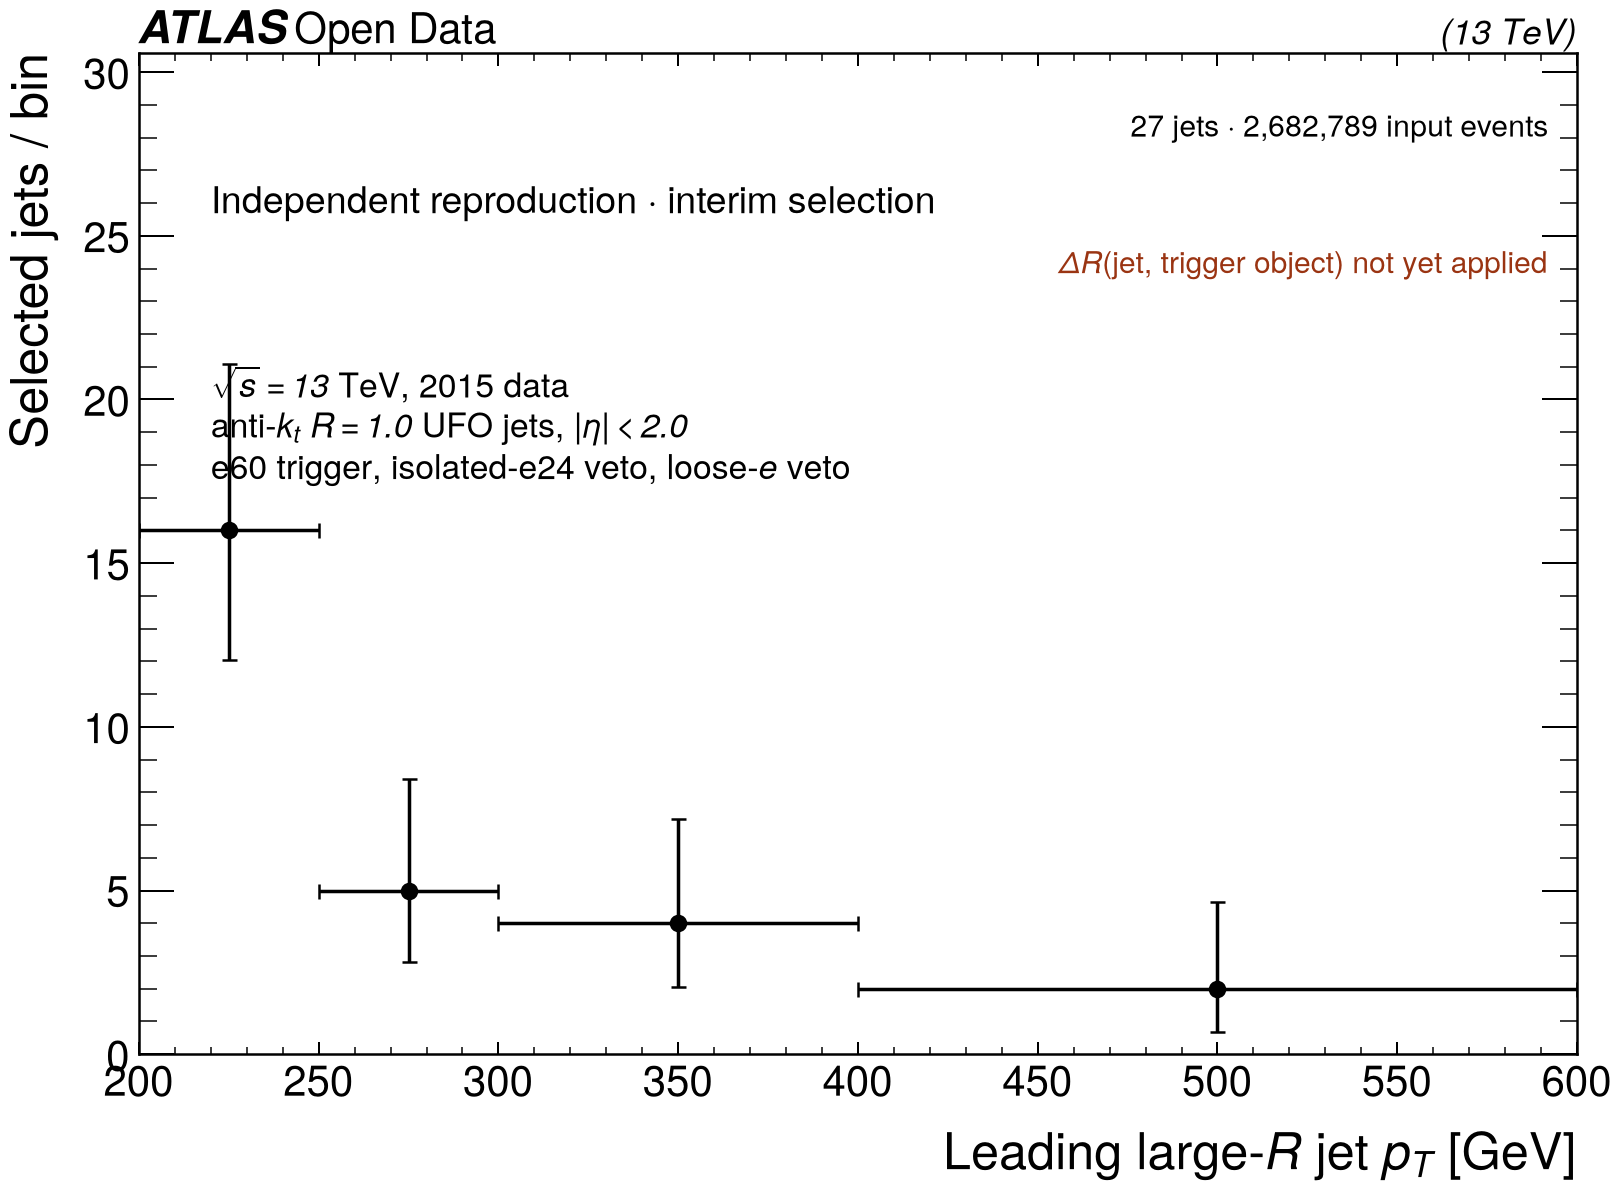
ATLAS-style leading large-radius jet transverse-momentum spectrum for 27 collision-data jets passing the electron-trigger and offline-electron-veto stages, with asymmetric Poisson error bars.
Electron-trigger-selected data spectrum, interim. Twenty-eight checksum-indexed files from 2015 runs 276181 and 284484 provide 2,682,789 input events. The decoded HLT_e60_lhmedium requirement leaves 10,625 events; 992 remain after vetoing HLT_e24_lhmedium_iloose_L1EM20VH, 310 after the loose offline-electron veto, and 27 contain a leading anti-kt R=1.0 UFO jet with pT ≥ 200 GeV and |η| < 2. Coarse bins and asymmetric 68% Poisson uncertainties reflect the limited count. This is not yet the final thesis-equivalent selection: the ΔR(large-R jet, electron-trigger object) > 1.5 requirement is still pending.
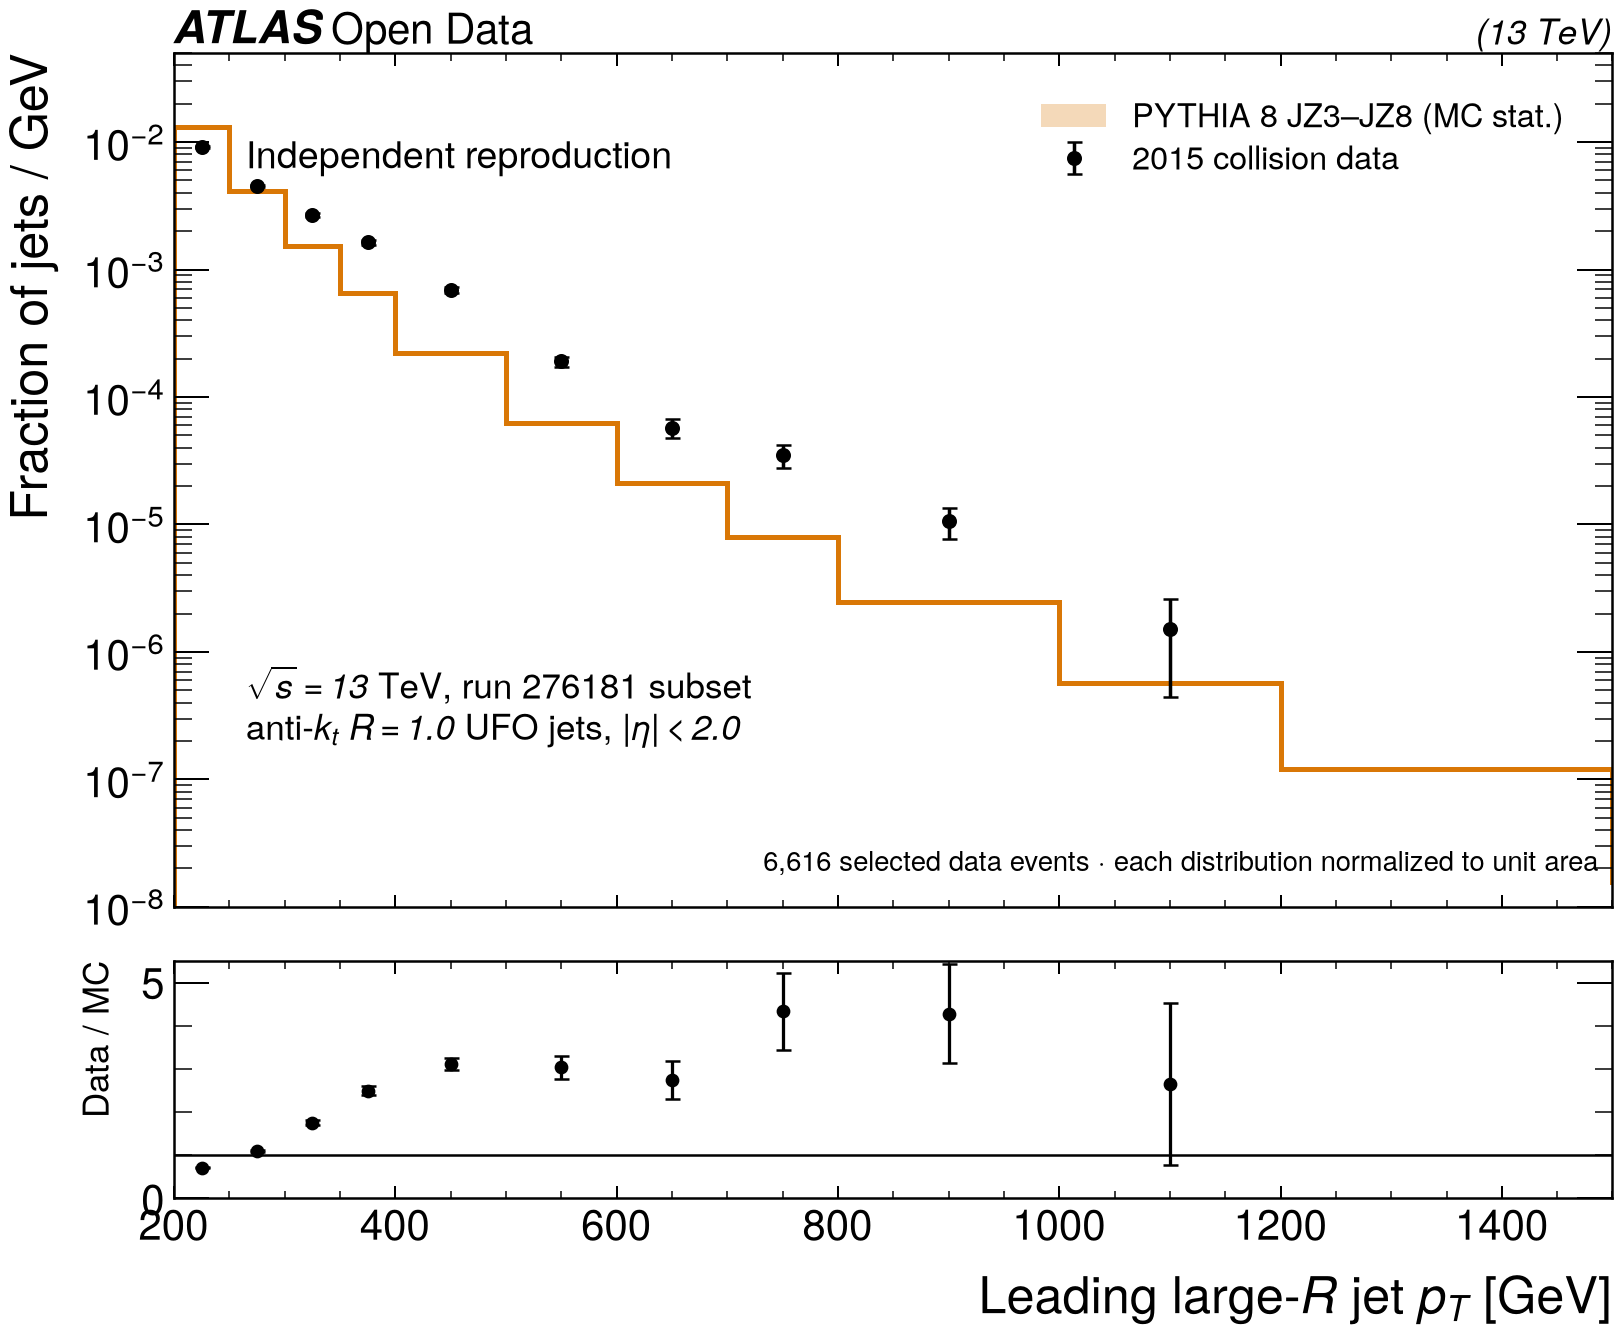
ATLAS-style unit-area comparison of the leading large-radius jet transverse-momentum distribution in a subset of 2015 collision data and stitched PYTHIA 8 simulation, with statistical error bars and a data-to-simulation ratio panel.
First collision-data overlay. Black points show 6,616 selected leading large-R jets from 139,563 events in eight checksum-verified files from 2015 run 276181; vertical bars are √N counting uncertainties. The orange histogram is the cross-section-stitched PYTHIA 8 JZ3–JZ8 prediction with its simulation statistical band. Both distributions are normalized to unit area, so this tests shape rather than yield. The data subset is currently trigger-inclusive: its harder spectrum is expected to retain trigger-selection bias. This is a transparent validation stage, not yet the thesis-equivalent electron-trigger, electron-veto, and ΔR selection.

Corrected trigger cut flow. The HLT decisions are decoded from the packed trigger bitset using the chain counters stored in each file's embedded trigger menu; this is essential because the counters change between menus. The expanded 2.68-million-event cut flow is reported in the plot above. The earlier overlay remains visible as a trigger-bias diagnostic, while the simulation comparison remains withheld because only 21 events survive in the six current PYTHIA pilot files and they do not adequately cover the data-dominated low-pT region.
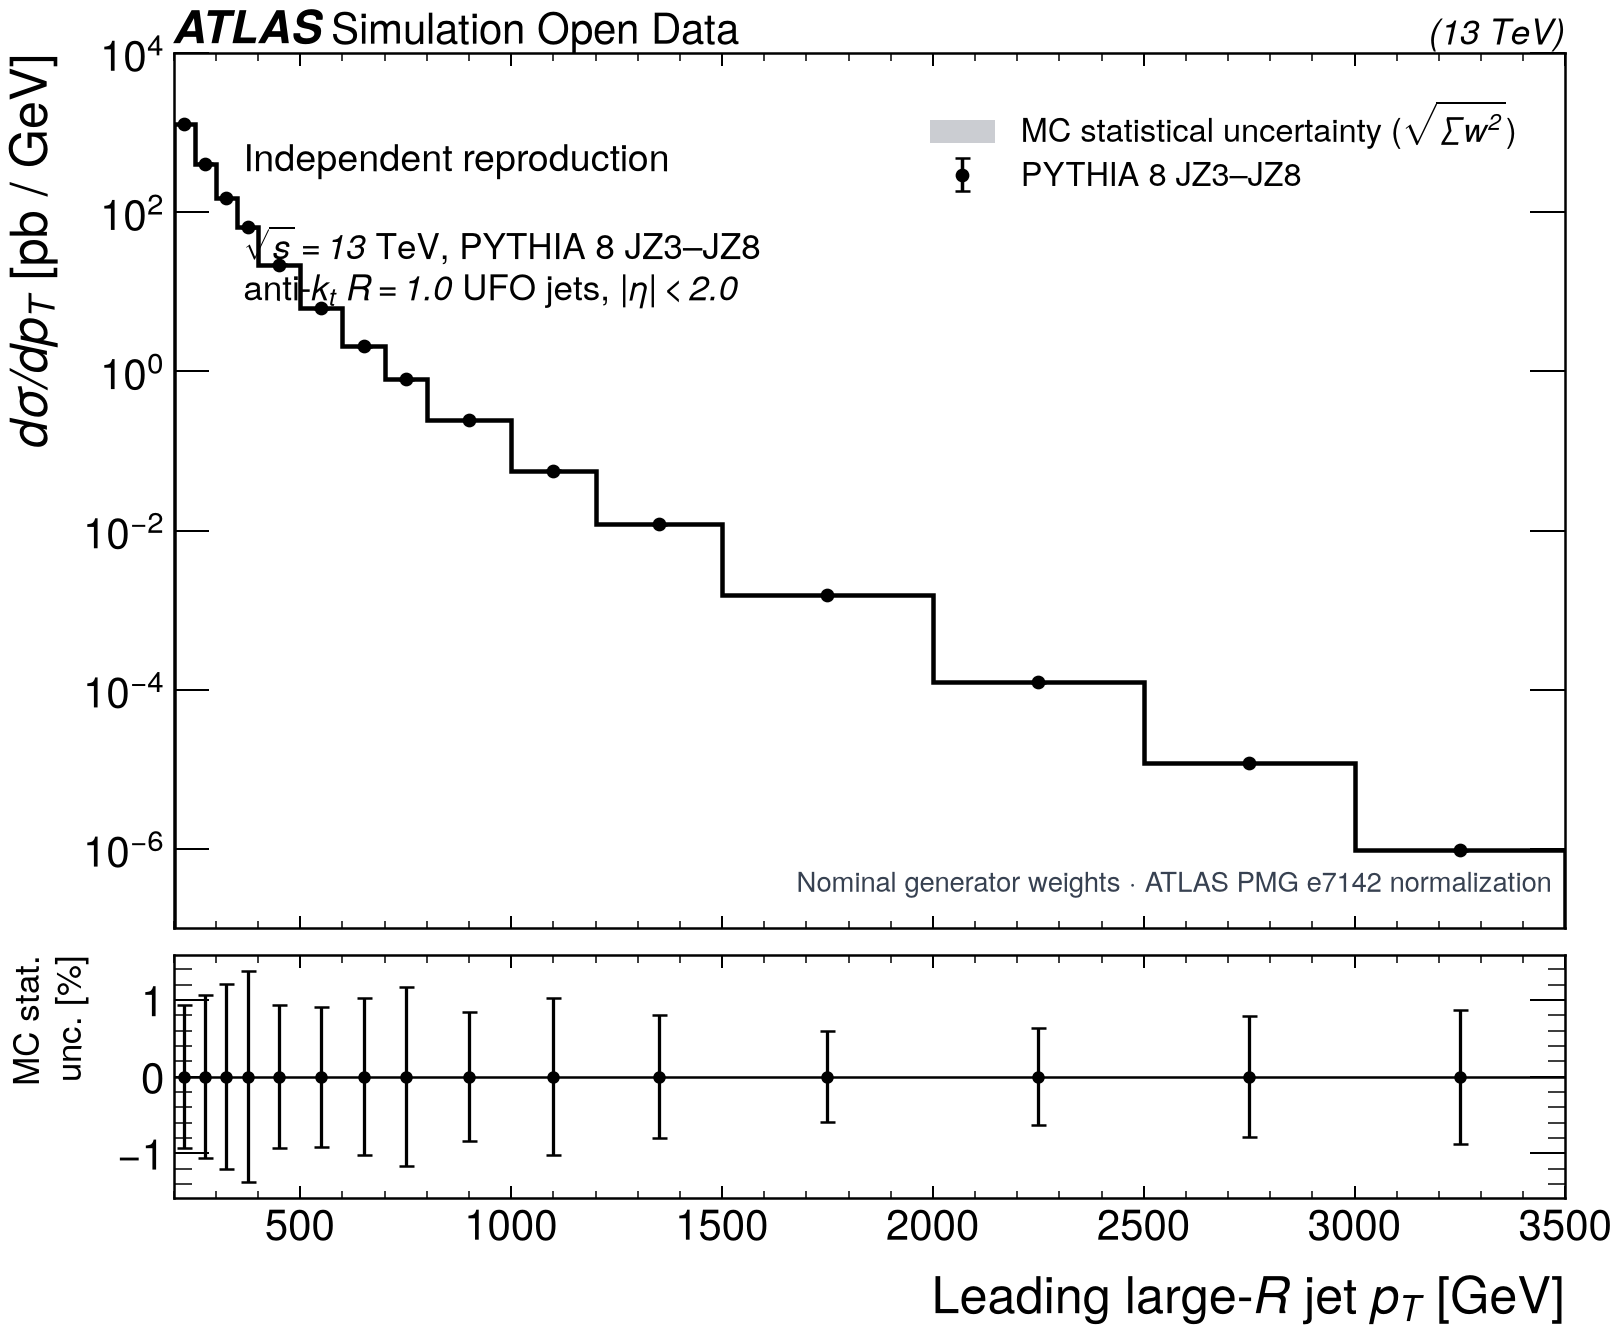
ATLAS-style cross-section-normalized leading large-radius jet transverse-momentum spectrum stitched from the public PYTHIA 8 JZ3 through JZ8 QCD simulation slices, with statistical error bars and a relative-uncertainty panel.
Cross-section-stitched simulation. The leading anti-kt R=1.0 large-R jet spectrum from the public PYTHIA 8 JZ3–JZ8 samples, rendered with the mplhep ATLAS style. Each event uses its nominal generator weight; each slice is normalized by σgen × filter efficiency × k-factor divided by the file-level CutBookkeeper sum of weights. The cross sections, efficiencies, and k=0.833 are the ATLAS PMG e7142 values matching Pythia 8.235. Point error bars and the grey band show √∑w2; the lower panel makes the small relative simulation statistical uncertainty visible.
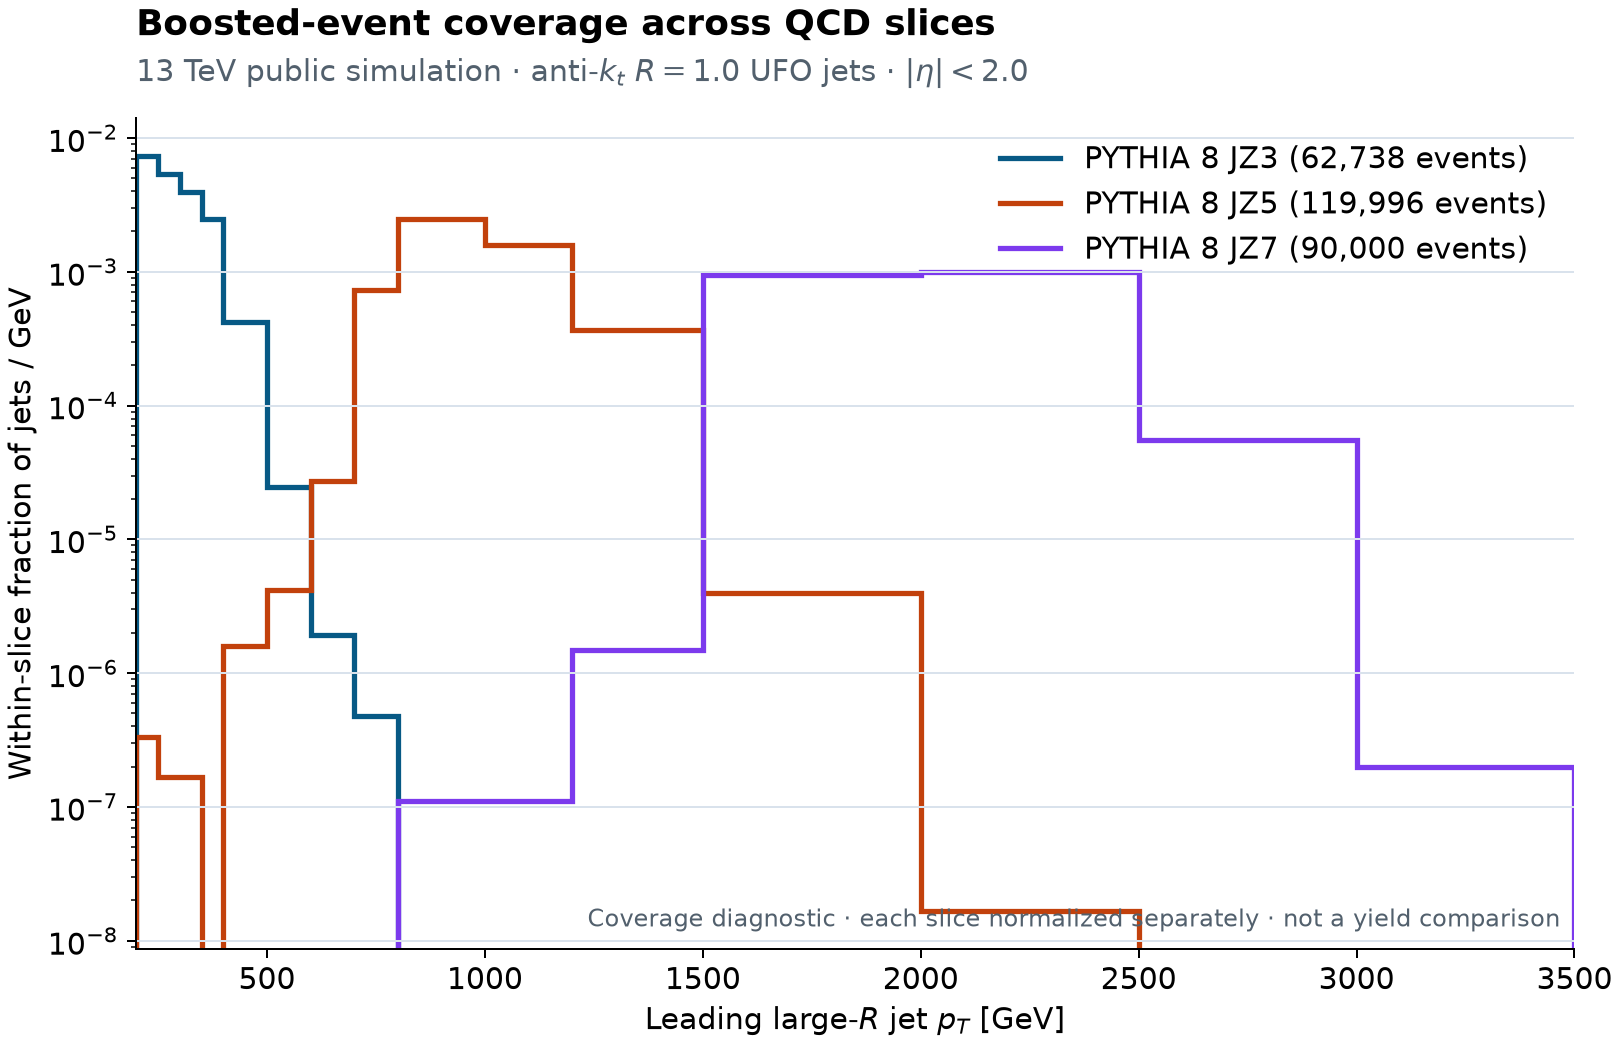
Unit-normalized leading large-radius jet transverse-momentum distributions for the PYTHIA 8 JZ3, JZ5, and JZ7 QCD simulation slices, demonstrating coverage beyond 3 TeV.
Boosted coverage check. The initial JZ3 pilot ends below 0.8 TeV, while JZ5 reaches about 2 TeV and JZ7 extends beyond 3 TeV. Each slice is normalized separately here, so the curve heights must not be compared as predicted yields. The next physics spectrum will stitch the slices using generator weights, cross sections, filter efficiencies, and summed event weights.
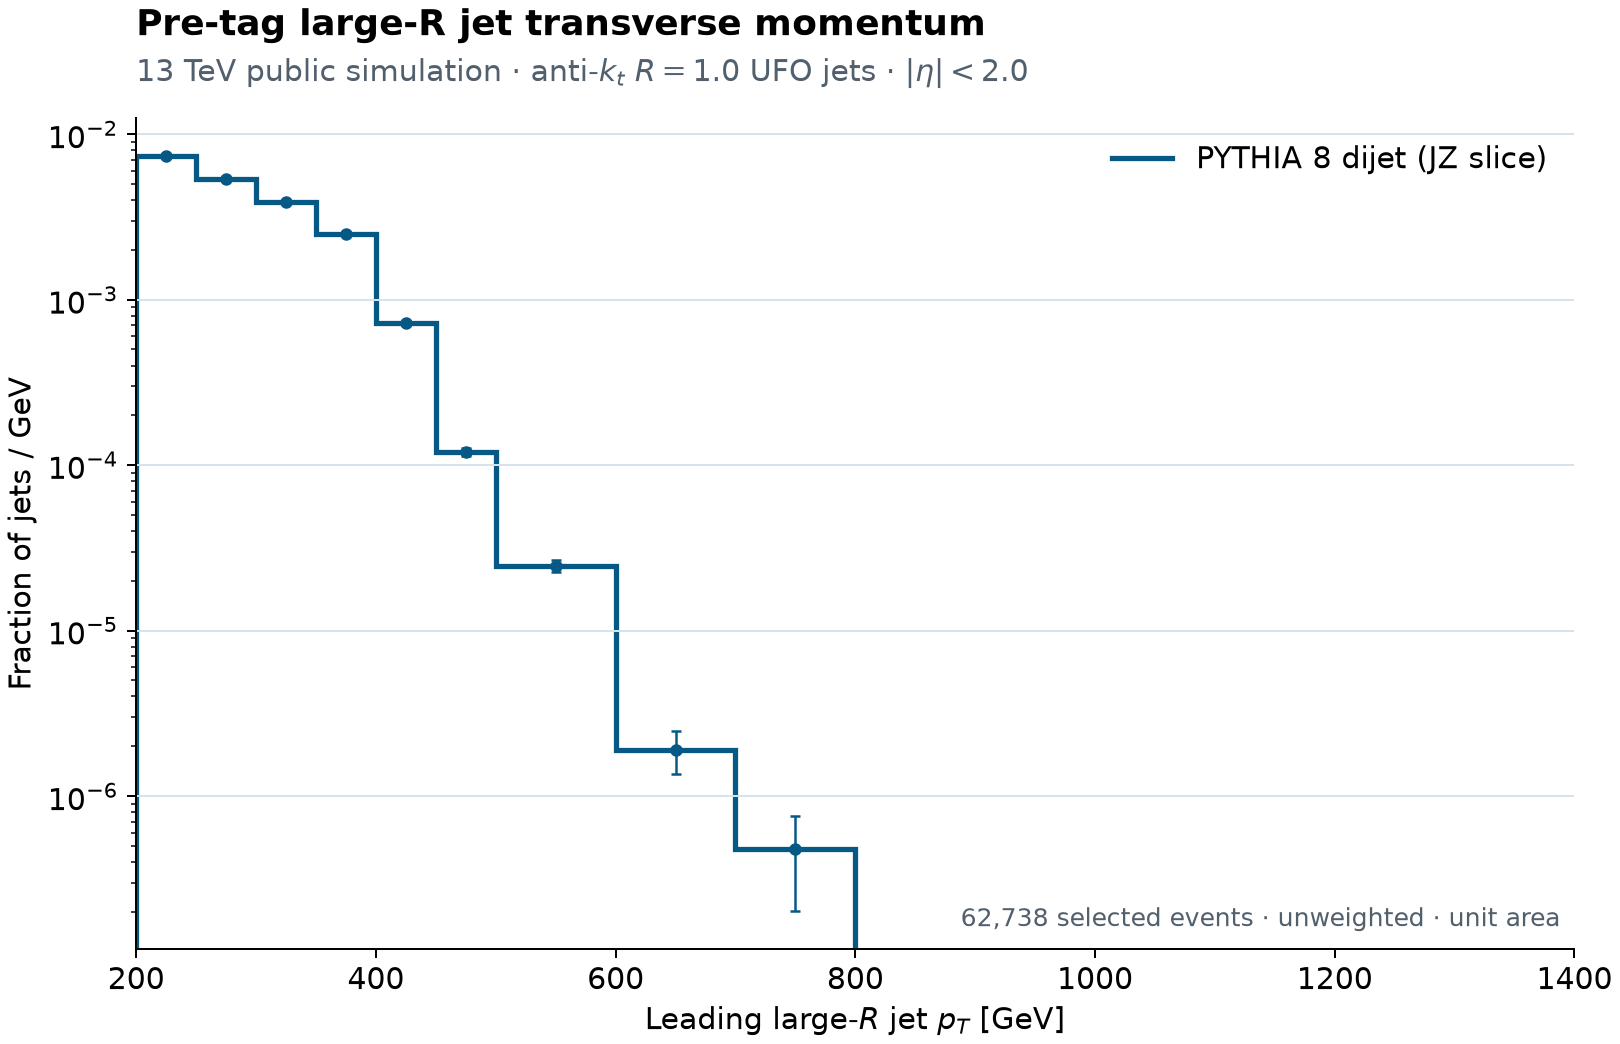
Unit-normalized pre-tag leading large-R jet transverse-momentum distribution from a 90,000-event PYTHIA 8 dijet simulation file.
First simulation result. Pre-tag leading large-R jet pT for 62,738 selected events from the low-pT public PYTHIA 8 JZ3 slice. Its lack of highly boosted events is expected and reflects the pilot sample, not the physics reach. This is a validated modern anti-kt R=1.0 baseline, not yet the requested historical C/A R=1.5 reproduction. Statistical uncertainties are shown; the distribution is unweighted and normalized to unit area.

Public data in scope

Collision data

Real proton–proton collision events recorded by ATLAS in 2015, with 2016 available for the extended study.

CERN record →

Standard Model simulation

Top-quark and QCD samples used to validate the selection and model the non-multijet contribution.

Top samples · QCD samples

Signal simulation

The release includes a 3 TeV Z′→tt̄ sample. A wider mass grid will require a documented supplemental simulation.

Exotic samples →

Reproduction path

  1. Validate the released event formatInspect objects, triggers, associations, metadata, and event weights.
  2. Rebuild the event selectionTwo boosted hadronic top candidates, a lepton veto, and associated b-tagged track jets.
  3. Reproduce the control regionsMeasure the multijet background from data using top-tag and b-tag multiplicities.
  4. Validate the mass spectrumCompare data with the Standard Model prediction in the reconstructed tt̄ invariant mass.
  5. Build the statistical modelPropagate uncertainties and calculate expected and observed limits on a heavy resonance.

What “reproduction” means

This is a modern public-data reproduction, not a bit-for-bit rerun. The open data were reprocessed with newer ATLAS software and calibrations than those used in 2016. Where an original object or calibration is unavailable, the replacement will be named, justified, and validated. Differences from the thesis will be reported rather than hidden.

Progress log

Primary sources